
As athletes and coaches continually look to maintain a competitive edge in professional sports, their interest in applying new technology to help them better understand and monitor human performance grows.
Plantar pressure measurement data — especially when integrated with data from other systems like inertial measurement units (IMUs) — help provide a complete picture of an athlete’s performance, which benefits both technique training and rehabilitation.
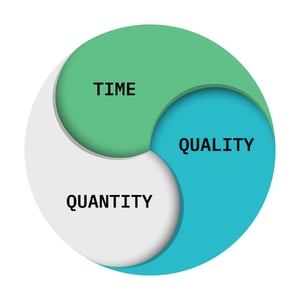
When analysing human movement, it’s important to understand how time, quantity, and quality impact each other.
Time
Movement occurs over time and the majority of biomechanical and performance analysis are based on movement-relevant time intervals. (Knudson, 2007)
We use time intervals when describing cyclical patterns like running and sprinting (usually divided in different phases occurring at different times) to analyze the effect of a force acting over time (i.e. impulse) and muscle mechanics (the time it takes for a muscle to reach the peak tension).
Any change in motion is created over time and it follows the force-time principle, which states that the time over which force is applied to an object affects the motion of that object.

Quantity and Quality
Quantitative analysis describes and analyzes movement numerically — such as a statistical analysis of predetermined performance markers — while qualitative analysis describes and analyzes movements non-numerically, by seeing movements as patterns. (Bartlett, 2007)
Data Integration
Taking a holistic approach to analyzing human performance means understanding how various systems and subsystems act together — in other words, different datasets must be integrated in order to understand the whole picture.
The term integration in sport performance science usually refers to a multidisciplinary approach, including analyzing information about multiple variables from different disciplines, whether it’s biomechanics, physiology or psychology. (Balagué et al., 2016)
Integrating and Analyzing Data with Intelligent Insoles | Pro 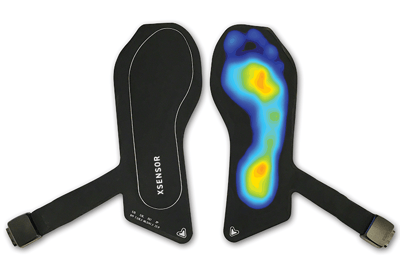
Pressure mapping technology provides sport scientists, strength and conditioning coaches, and rehab professionals with an easy, accurate, and reliable way to integrate movement-relevant time intervals with quantitative and qualitative data to gain a better understanding of human movement.
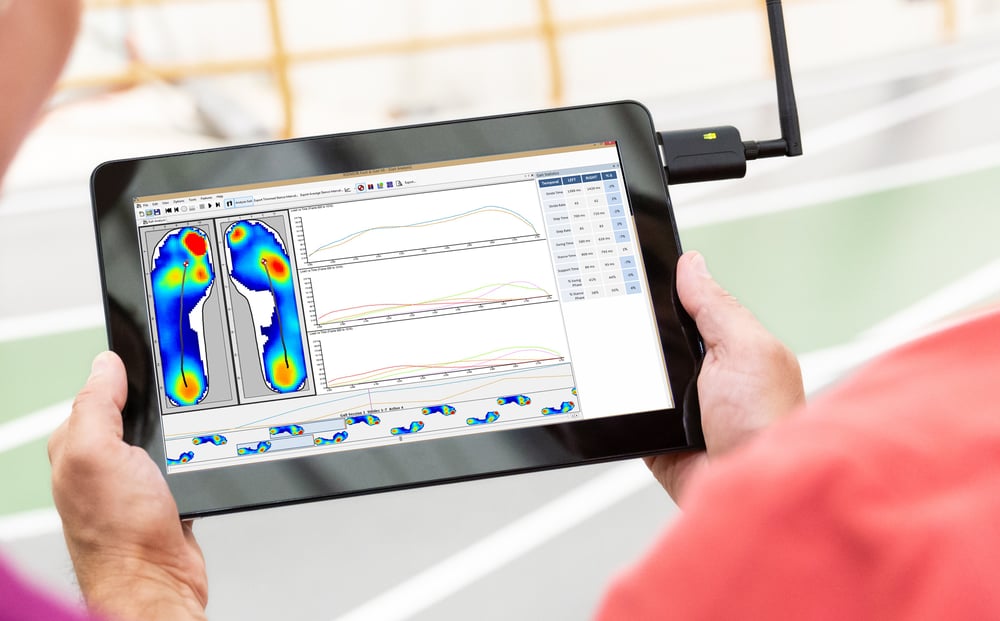
Intelligent Insoles | Pro makes it easy to integrate different datasets, thanks to its ability to combine plantar pressure data from its insole sensors and spatio-temporal data from an externally added IMU (Inertial Measurement Unit), which can both be analyzed using the powerful Pro Foot & Gait software that comes with the system.
Analyzing Time, Qualitative, and Quantitative Datasets with Pressure Sensors, IMUs, and X4 Software
Time
Time intervals are used to understand the behaviour of applied force over time, as well as the timing and duration of each phase of the gait cycle. The integration of pressure and IMU data provides two fundamental datasets that can be analyzed in the Pro Foot & Gait software:
- Force (Pressure) vs Time Curve
- Gait Statistics
Force (Pressure) vs Time Curve
The force (pressure) versus time curve has a fundamental role in the evaluation of human performance. In the context of sport performance, it’s one of the most important principles of applied biomechanics.
As shown in the graph below from the Pro Foot & Gait software, we can evaluate the force-time relationship bilaterally, as well as the duration and magnitude of impact forces and propulsion phase.
Gait Statistics
Gait statistics offer powerful insights into stride duration, and left/right swing and stance, making it possible to spot asymmetries during gait as well as the standard deviation in percentage. Advanced algorithms can extract complete gait cycles. Analysis of gait cycles is completed by the merging of plantar surface pressure with IMU data to provide accurate stance and swing phase temporal statistics in sync with visualization of plantar surface pressure progression.
Quantity
Whether it’s force, pressure, speed, or angles, quantitative measurements answer the question: “How much?”. It refers to the data that can be put into numbers.
The cyclogram and 3-Box Analysis represent the two most important datasets within this category.
Cyclogram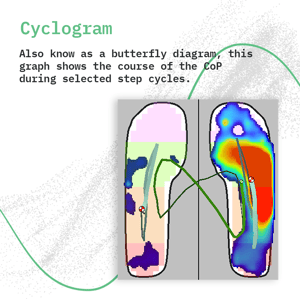
The cyclogram (also named butterfly diagram) is a graph showing the course of the CoP (Center of Pressure) during selected consecutive step cycles. It’s a good indicator of the variability of the CoP and overall neuromuscular stability during gait and running.
With the cyclogram, you can measure and calculate the magnitude of CoP variability laterally and in anterior/posterior direction, as well as the lateral symmetry during walking and running. This provides powerful insights into dynamic stability and movement symmetry and compensation.
3-Box Analysis
The 3-Box Analysis allows for the isolation of the foot into regions of interest in order to analyze pressure values and force-time curves individually for each zone of the foot (rearfoot, midfoot and forefoot).
Isolating the curves for each foot zone allows coaches to further evaluate the function of the foot and identify specific weak spots in different segments that would otherwise go undetected — even with the most experienced and skilled coach.
Quality
Qualitative data focuses on geometrical patterns instead of numbers. Peak pressure images and CoP trails represent the two most important datasets within this category.
Peak Pressure Image
A peak pressure image shows all the peak pressure zones in the sole of the foot during an entire rollout over the stance phase.
With peak pressure images, we can detect abnormal high or low pressure areas as well as left/right asymmetries in the footprint.
CoP Trails
With the X4 Intelligent Insoles, you can track the CoP path during walking, running, and sprinting, and during any movement patterns such as a squat or lunge.
There are two important aspects to consider when evaluating the trails and progression of the CoP:
- Trajectory
- Starting/Ending Point
By trajectory, we mean the shape of the CoP’s trail during foot rollout, reflecting the level of stability and movement efficiency in dynamic activities.
For the starting and ending point, we refer to the point where the CoP begins and ends its progression, as a direct consequence of the dynamics of the foot strike and propulsion.
Accurately measuring time, quantity, and quality as it relates to human performance requires a toolset that captures plantar pressure and spatio-temporal data.
By combining Intelligent Insoles | Pro and IMU data, athletes and coaches can gain insights that provide a competitive advantage when it comes to training and rehabilitation.
To learn more about how plantar pressure measurement systems can help biomechanics professionals minimize athletic injury and maximize human performance in their clients, download our ebook Intro to Plantar Pressure Mapping in Sport.

References
Balaguè N et al., Sport science integration: An evolutionary synthesis, Eur J Sport Sci. 2017 Feb;17(1):51-62.
Bartlett, R. (2007) Introduction to sports biomechanics. 2nd edn. Routledge.
Knudson, D. (2007) Fundamentals of biomechanics. 2nd edn. Springer.