One of the most important aspects of plantar pressure mapping technology is that, when it comes to the data obtained, we can go beyond the force-time or pressure-time curves and access several other metrics unique to this technology.
A compelling feature is related to the ability to track the movements of the center of pressure (CoP) with the sensorized insoles across different stances.
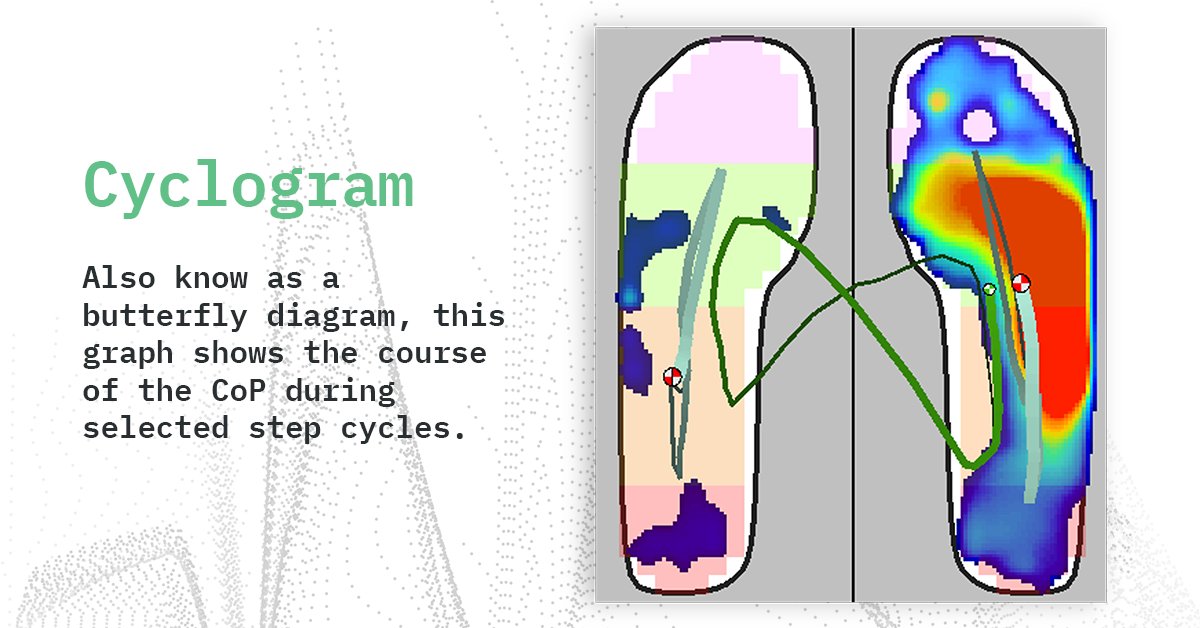
The cyclogram, also known as a butterfly diagram, is one of the most interesting graphs associated with CoP movements, as it tracks the combined CoP across both sensors.
What Is the Cyclogram?
The cyclogram is a graph that results from different measurements related to the CoP movements during the stance phase of gait.
To understand how the cyclogram is generated, it is necessary to understand what a gait line is.
 Monitoring the movement of the CoP throughout the gait cycle provides valuable temporal and spatial data, which is essential for illustrating overall movement patterns. This approach not only enhances our understanding of functional dynamics but also facilitates the identification of potential areas of concern and raises flags on potential injury risk or decreases in biomechanical efficiency.
The CoP gait line is a graphic representation of the stance phase of gait, where the foot remains in contact with the ground. This phase is mapped by considering every contact pressure point and its respective value.
The CoP gait line is constructed from a series of pressure points plotted in sequence according to time, captured at a specific sample rate—commonly between 120 and 300 samples per second. Each plotted point signifies a CoP position, starting from the initial heel contact, typically at the lateral aspect, and progressing through to toe-off, which marks the end of the stance phase.
In XSENSOR’s Pro Foot & Gait software, the gait line length is a metric representing the distance traveled along the curved gait line, while the gait line velocity is the average speed of the gait line, that is, the gait line length divided by the elapsed frame time from the start of the gait line until the end.
To fully grasp the objectives and value of the CoP gait line progression, it is essential to consider the prerequisites for effective human locomotion. These include accommodating body mass, supporting it on a single limb, advancing the opposite limb, and sustaining continuous ground contact. By examining the location, speed, and shape of the CoP gait lines, we can obtain quantifiable insights into how effectively athletes’ ground contacts establish a stable base of support during the stance phase, facilitate forward movement of body mass, optimise energy efficiency, and utilize appropriate strategies for shock absorption and force dissipation.
The Role of the Cyclogram in Biomechanical Assessment
The butterfly diagram reflects the repeated movement of the CoP during locomotion, capturing in a single frame many gait characteristics essential for efficient walking and running. For example, the diagram represents gait variability, stride width, single/double support, and symmetry in terms of weight shifting between the legs.
Human locomotion is characterised by adaptive walking across diverse environments, facilitated by the generation of appropriate motor commands within neural systems. Given that human walking and running behaviours necessitate the coordination of multiple joint movements, these motor commands must establish effective movement relationships both between legs (interlimb coordination) and between the joints within each leg (intralimb coordination) to accommodate varying environmental conditions. The mechanisms underlying such interlimb and intralimb coordination during gait remain incompletely understood, thereby garnering significant research interest.
The butterfly diagram presents a potentially valuable tool for investigating the mechanisms underlying interlimb and intralimb coordination in human locomotion as it provides with a clear information about how the left and right legs move in anti-phase, how much adaptable and variable a movement is, and the amount of anterior/posterior and lateral shifting of the weight, reflecting neuromuscular control and stability of the athlete.